This website contains visualizations that accompany the GECCO 2015 GDS submission, Confronting the Challenge of Quality Diversity
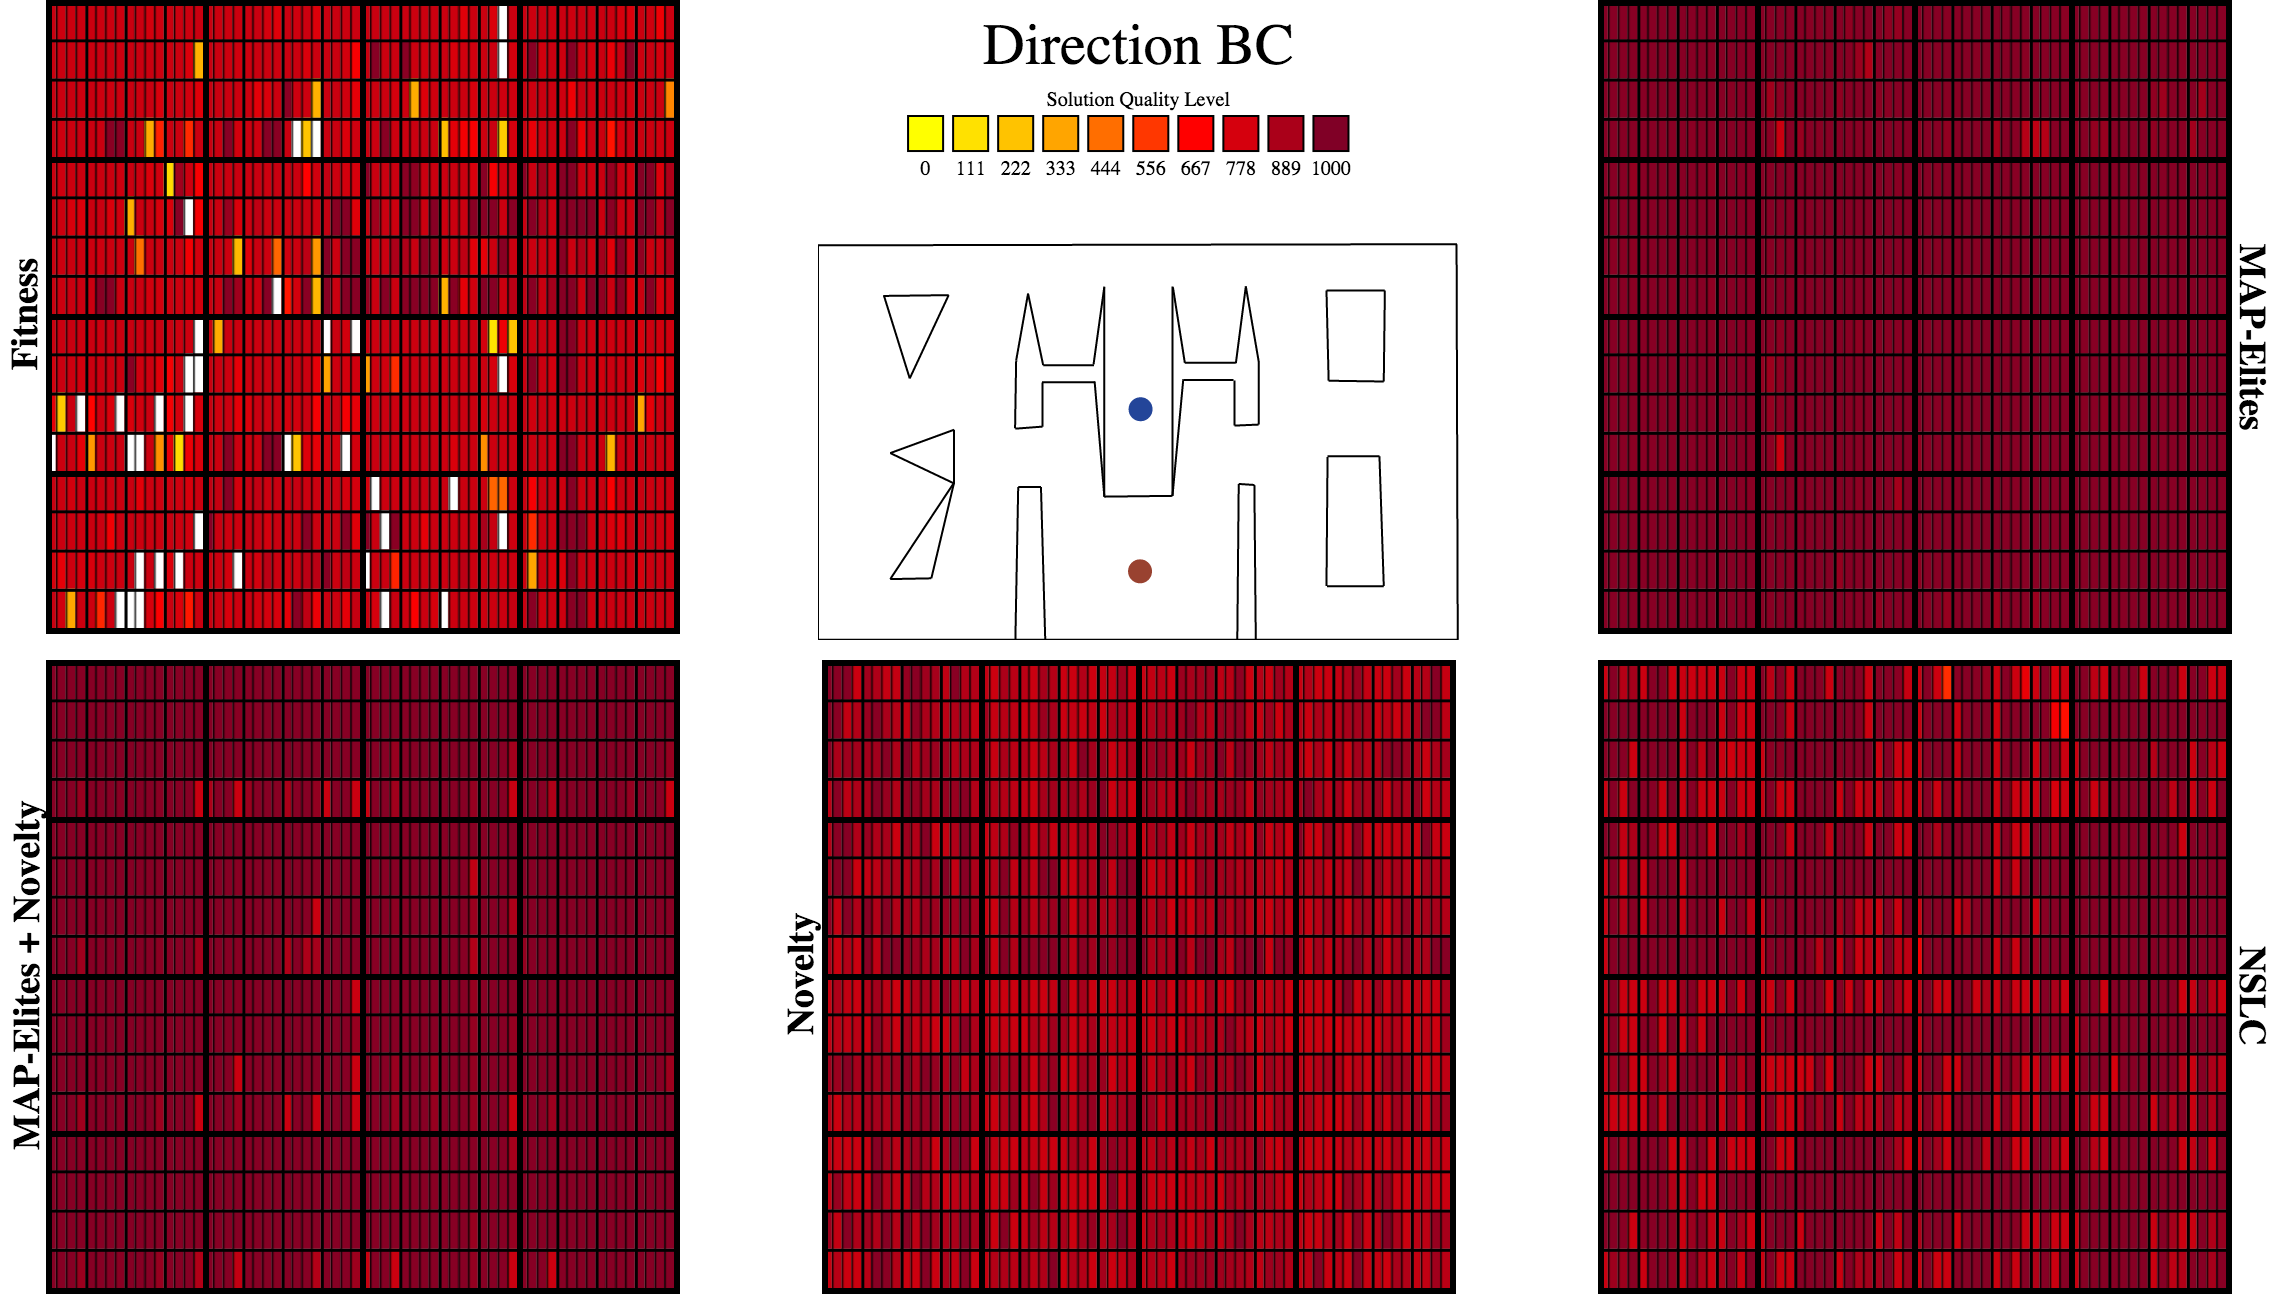
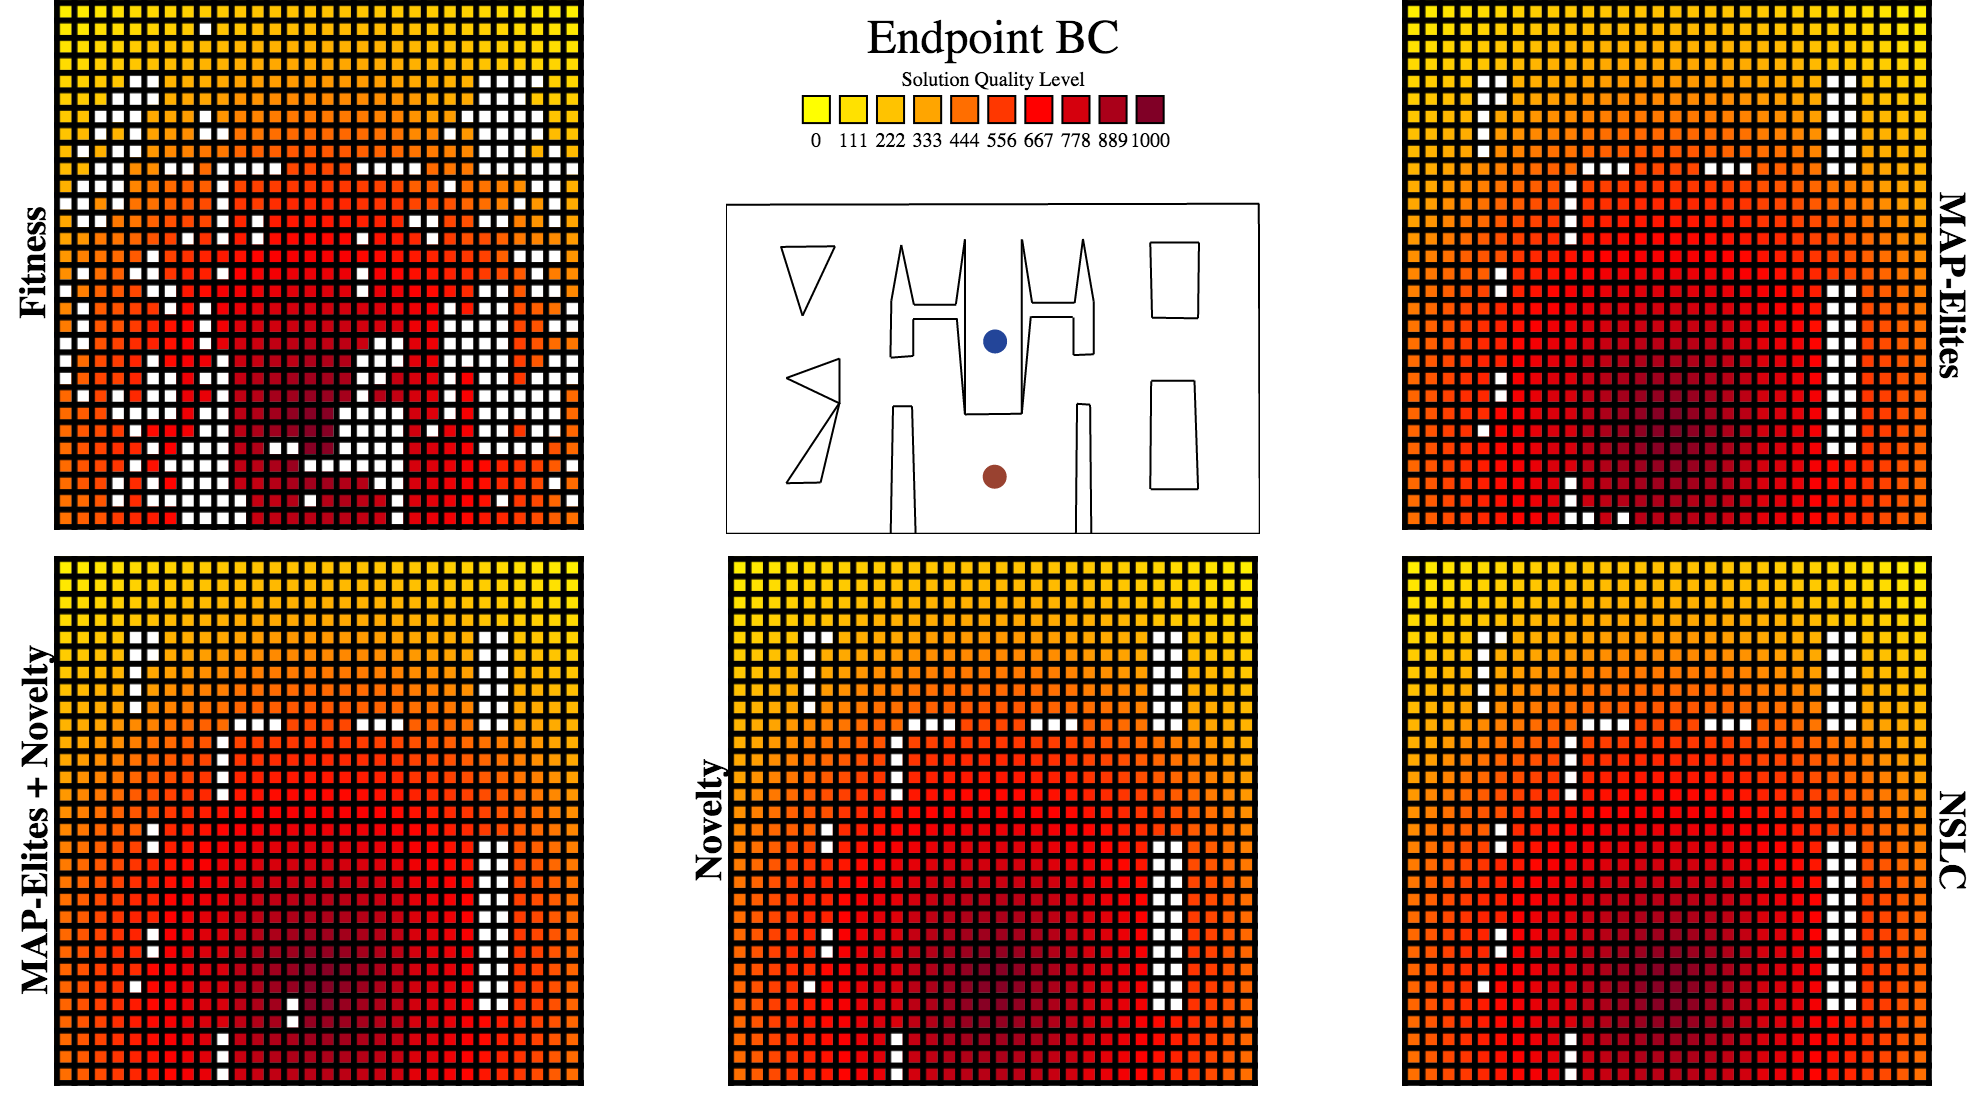
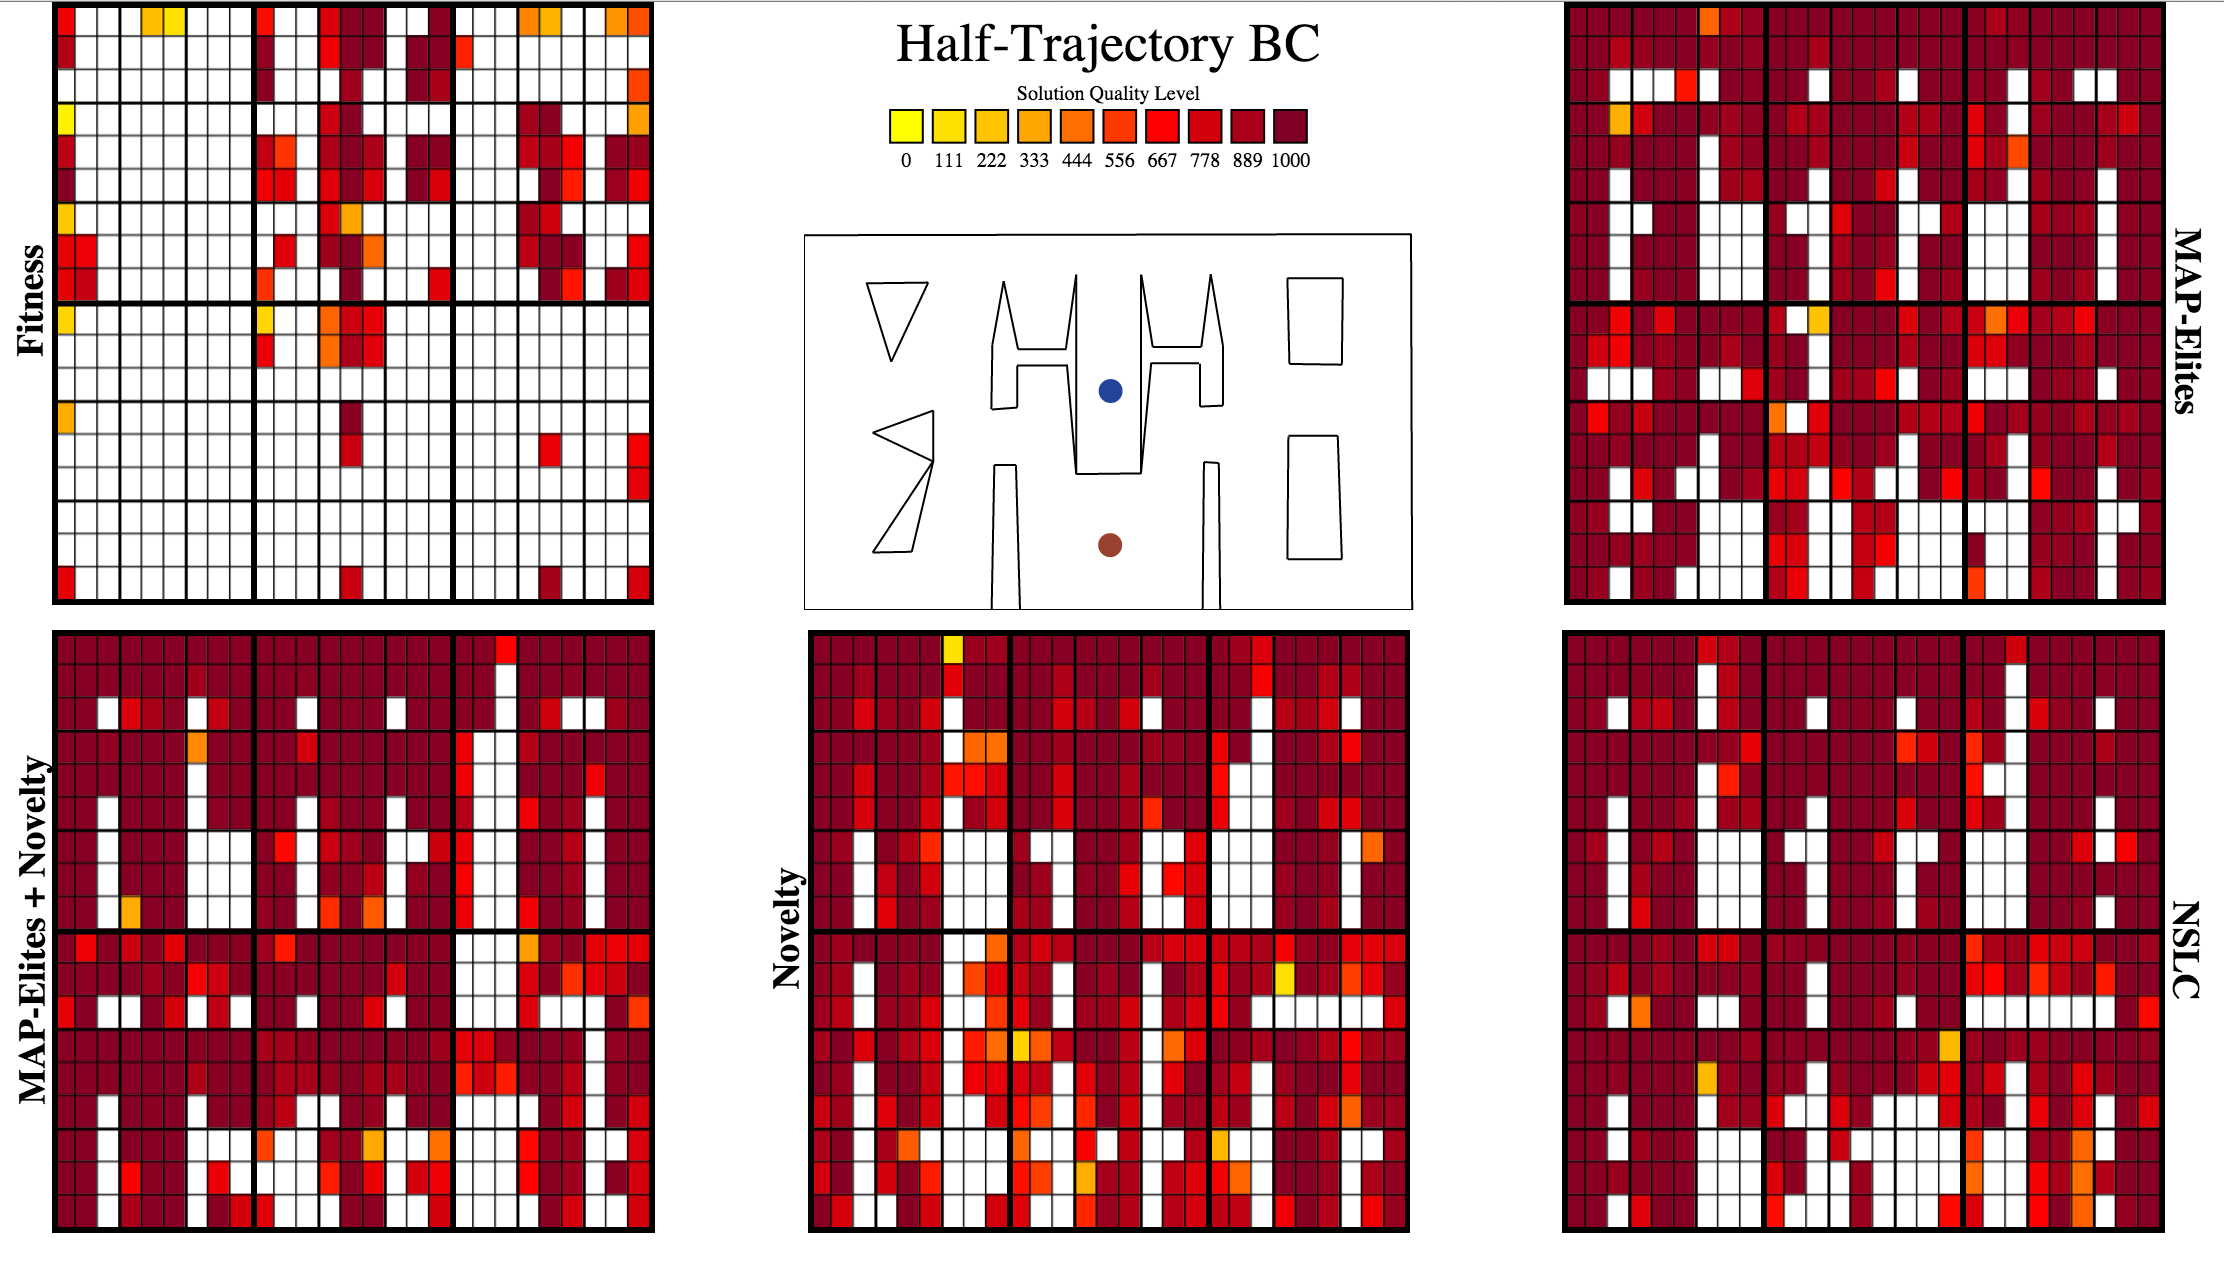
Each of the links below leads to visualizations of the behavior space grid from typical runs for all five variant methods tested in the paper (fitness, NS, NSLC, MAP-Elites, and MAP-Elites+Novelty) under a particular behavior characterization (BC).
Novelty variants do best in this very highly aligned BC.
MAP-Elites+Novelty joins the top performers NS and NSLC in this slightly less aligned BC.
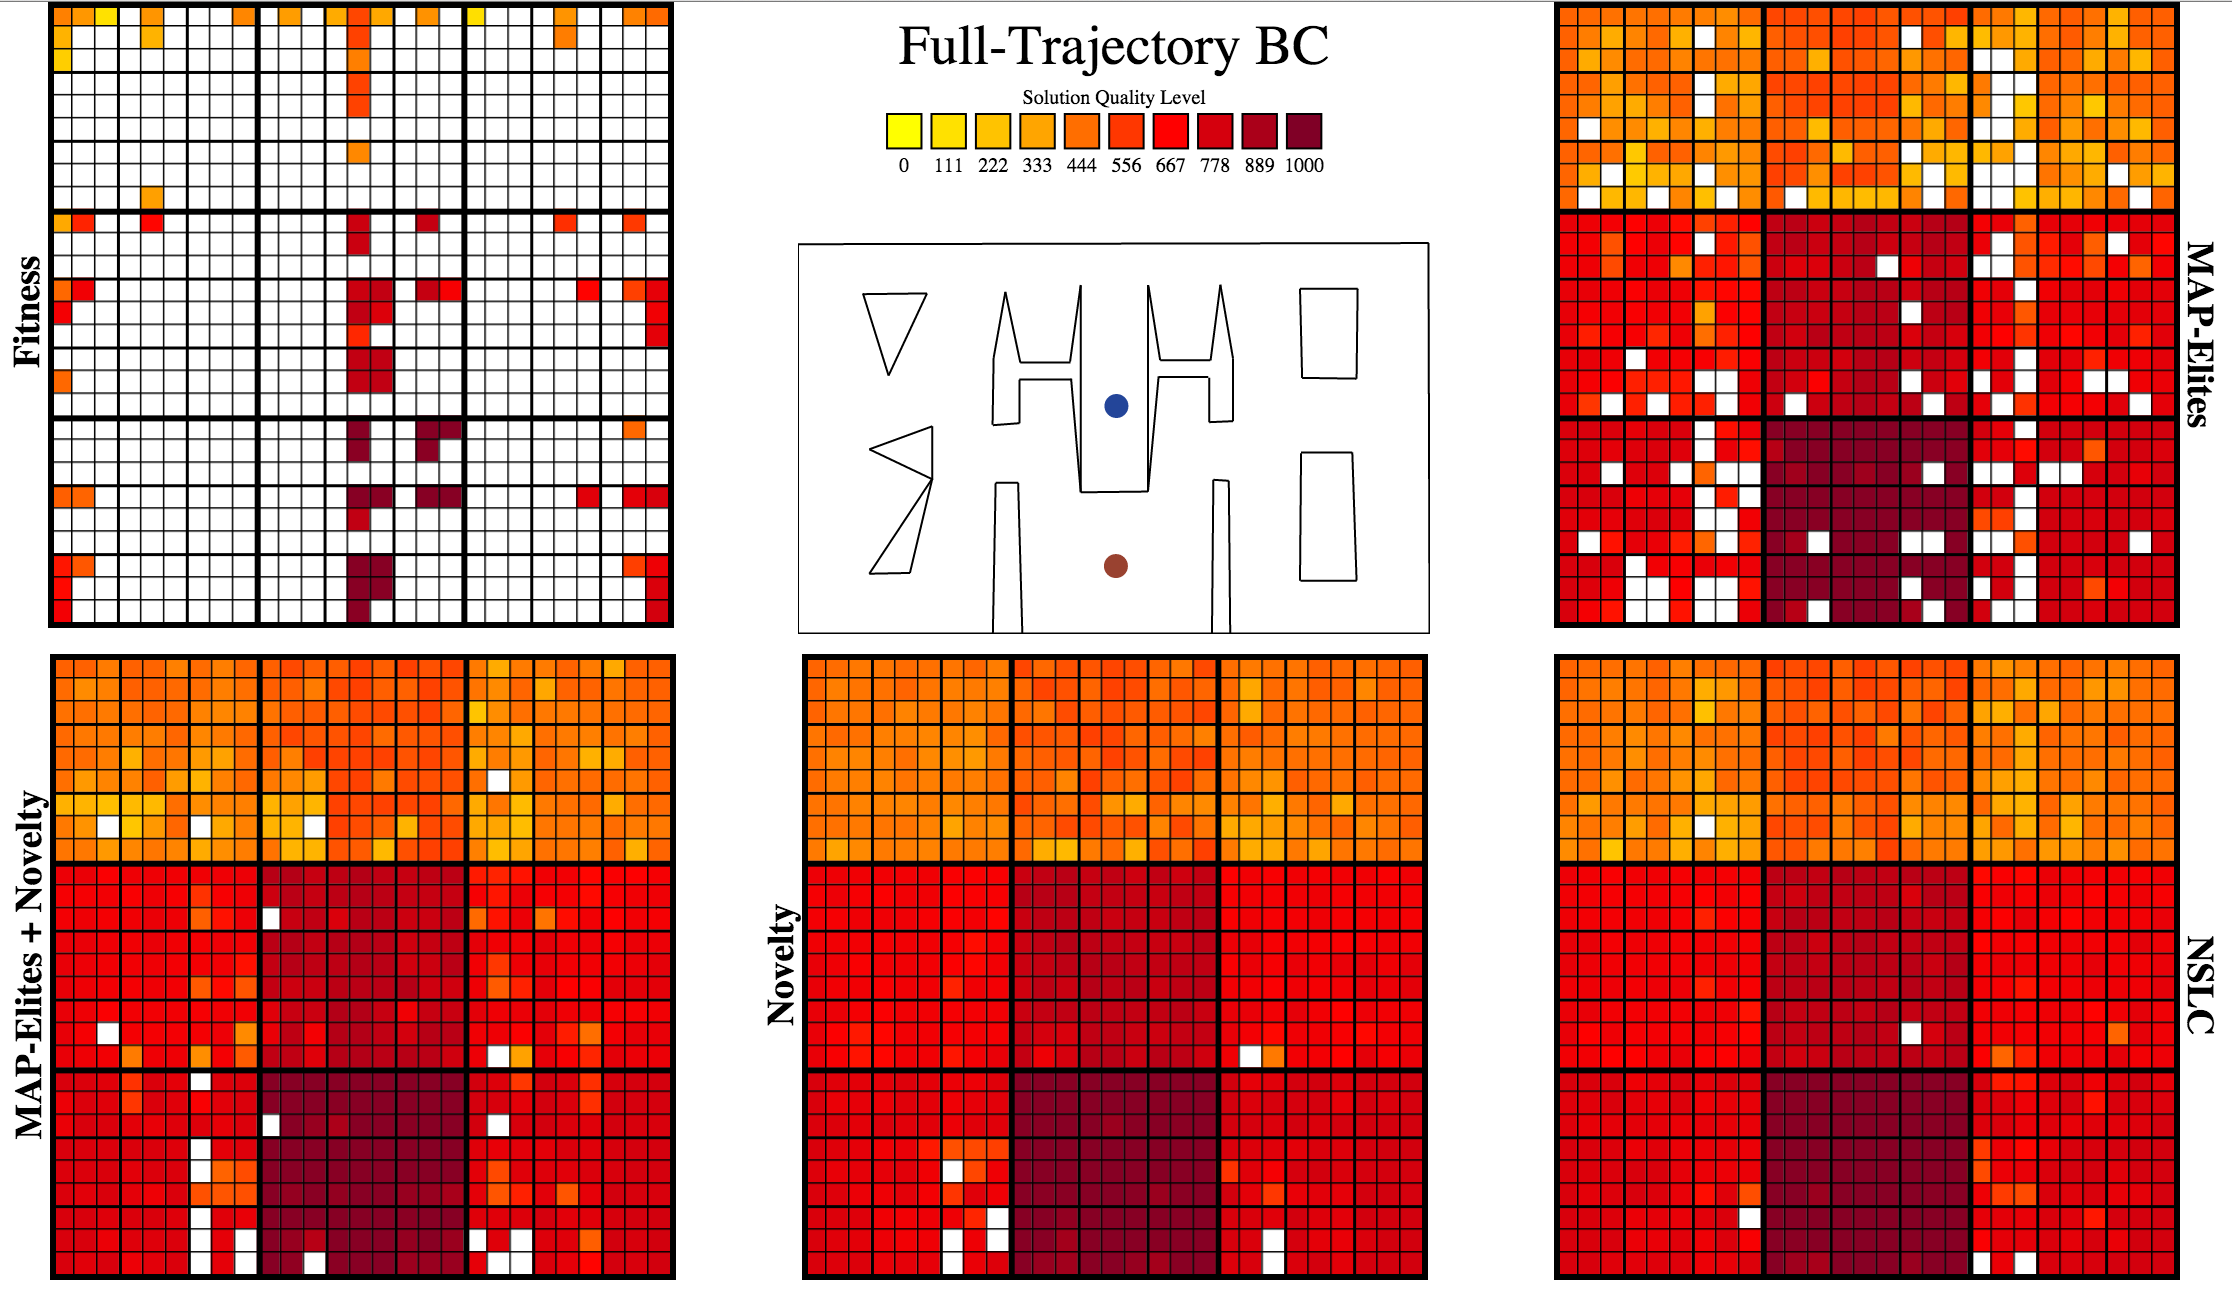
All the variants except raw fitness tie in this modestly-aligned BC.
MAP-Elites-based variants excel in this least-aligned BC.